Overview
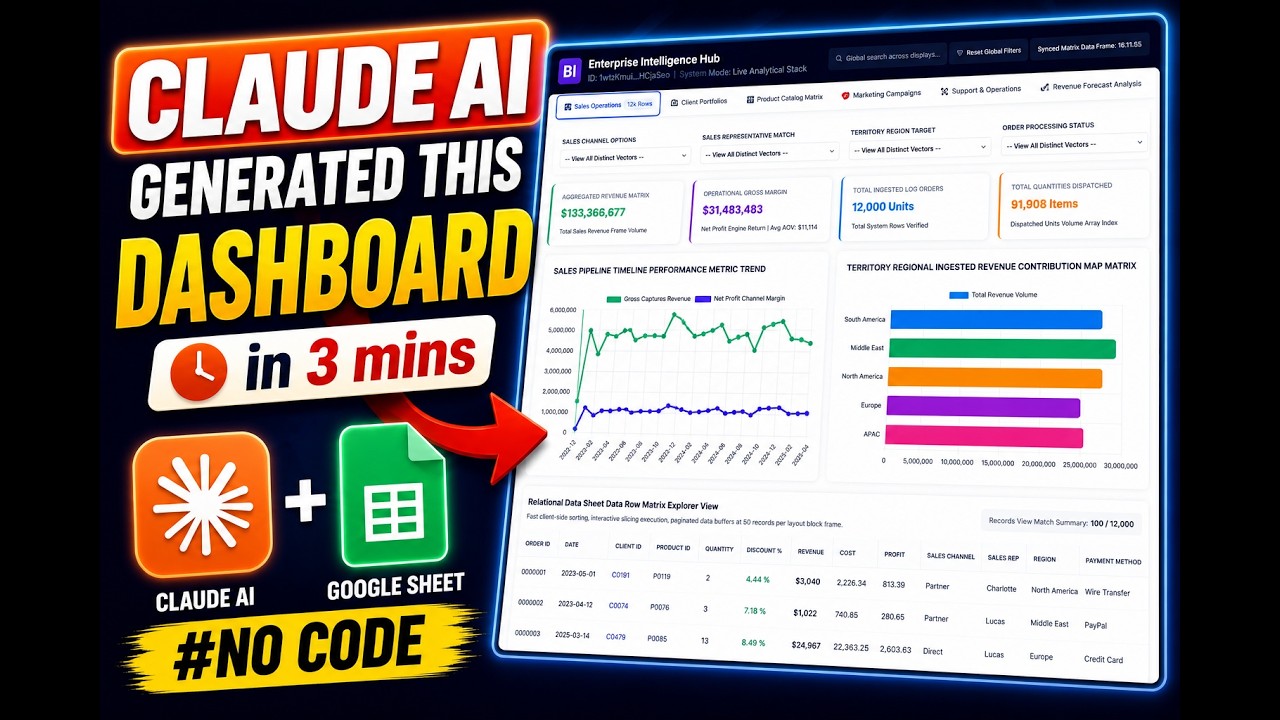
In this video I show you a free workflow I built that turns any Google Spreadsheet into a fully interactive, filterable dashboard in just three steps using Google Apps Script and AI, either Claude or Gemini.
No paid tools. No BI subscriptions. No manual configuration. Just your data and a script that does the heavy lifting for you.
Here is what makes this different from just asking an AI to build a dashboard. The Apps Script tool I built first scans your entire spreadsheet, understands the structure of your data, detects categorical columns like status and department, computes stats on numeric columns, maps your date ranges, and then packages all of that into a rich system prompt. That prompt is what you hand to the AI. Because the AI gets a proper briefing before it writes a single line of code, the output is dramatically better.
Your actual data never leaves your spreadsheet. Only the structure and shape of it is used to build the prompt.
Key Features
- Instant Copy: Copy the entire spreadsheet and script directly into your Google Drive in one click.
- Zero Cost: Completely free to use with any personal or workspace Google account.
- Customizable: Full access to modify sheet columns, layout, and Apps Script logic.
- Video Tutorial Included: Watch the step-by-step setup video right on this page.
How to Use
- Click Download Free Access above and enter your email address.
- Open the copy link delivered to your screen and inbox.
- Click Make a Copy in Google Drive.
- Follow the setup tutorial video above to configure any triggers or permissions.