Overview
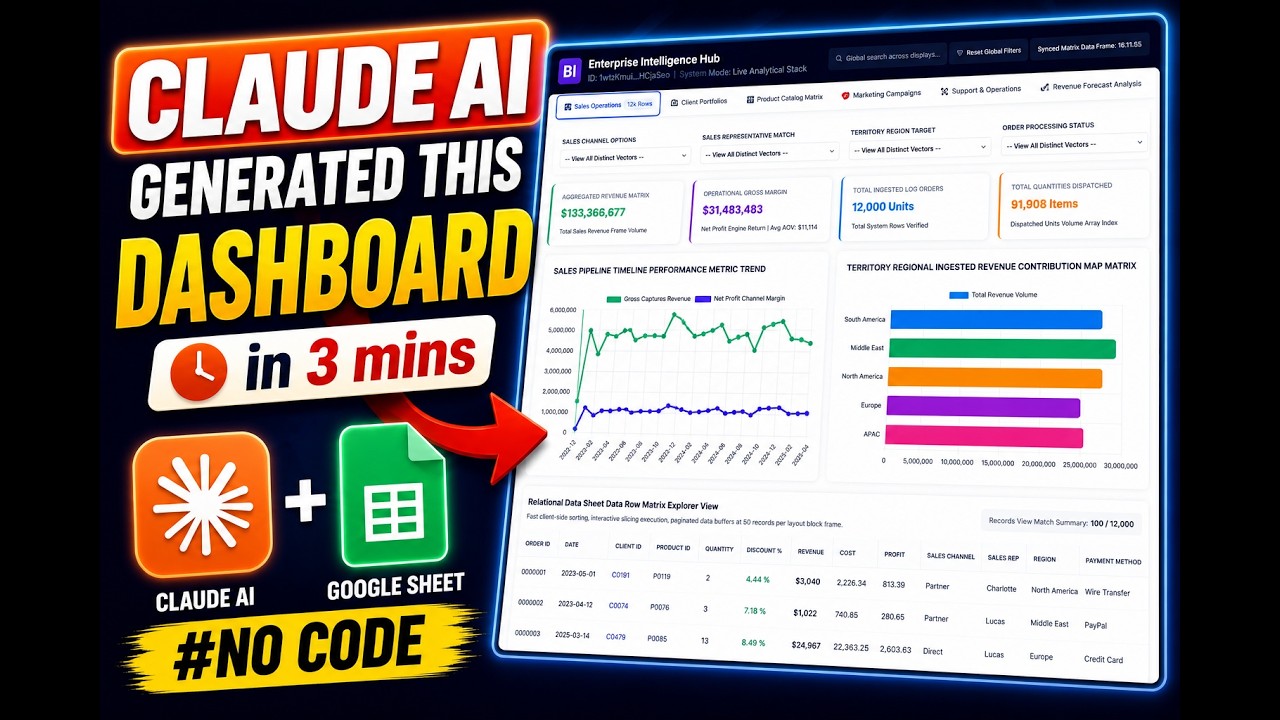
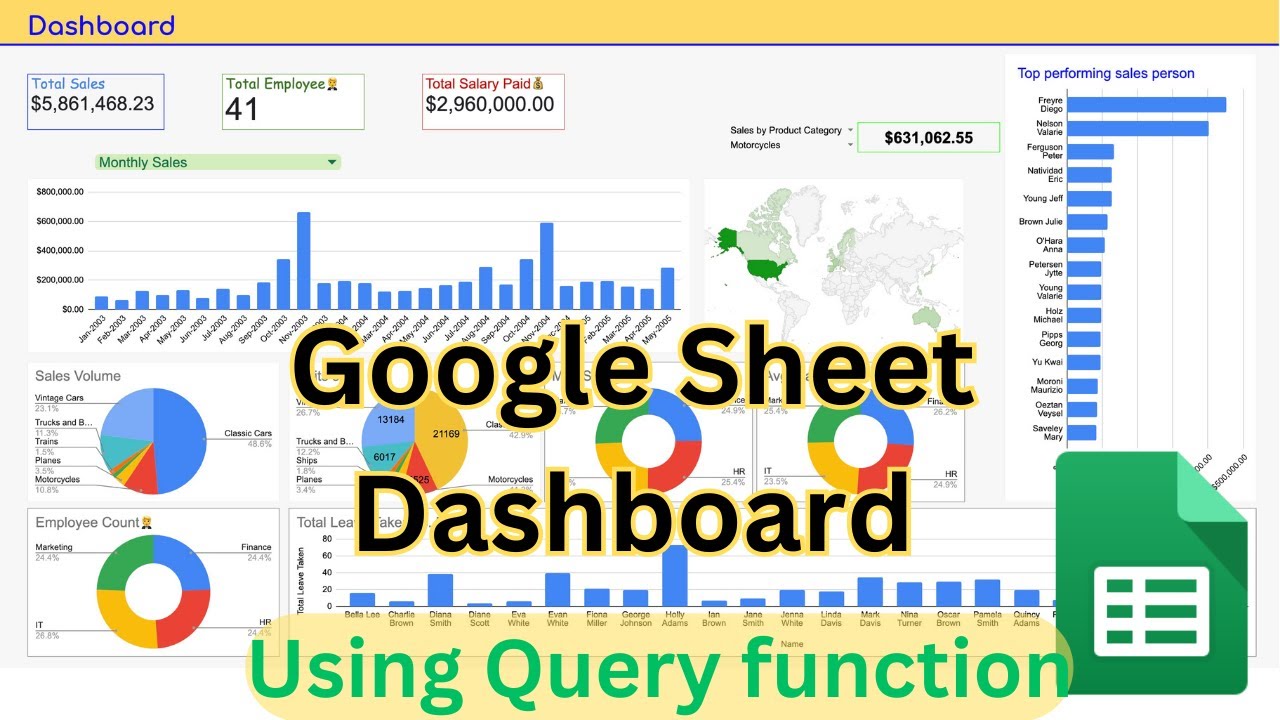
Welcome, everyone! In this comprehensive tutorial, I'll walk you through the process of creating rich and interactive dashboards using the Google query function. This dashboard not only showcases dynamic charts but also empowers you to perform filtering and queries, providing unparalleled insight into your data.
Throughout this video, you'll discover how to drill down into specific metrics, filter data based on various criteria, and switch between different chart views seamlessly. I'll demonstrate how to query your database directly within the dashboard, eliminating the need to navigate through raw data.
To build this dashboard, you'll need access to relevant datasets. I'll explain how to transform and clean these datasets to ensure they can be effectively utilized by your charts. Whether it's sales data, employee information, or leave records, I'll guide you through the process of preparing your data for visualization.
Using Google Sheets as our platform, I'll delve into the intricacies of chart data preparation. From grouping data based on specific fields to utilizing advanced query functions, you'll learn how to structure your data for optimal visualization.
Key Features
- Instant Copy: Copy the entire spreadsheet and script directly into your Google Drive in one click.
- Zero Cost: Completely free to use with any personal or workspace Google account.
- Customizable: Full access to modify sheet columns, layout, and Apps Script logic.
- Video Tutorial Included: Watch the step-by-step setup video right on this page.
How to Use
- Click Download Free Access above and enter your email address.
- Open the copy link delivered to your screen and inbox.
- Click Make a Copy in Google Drive.
- Follow the setup tutorial video above to configure any triggers or permissions.